Revealing Defects in Belt Drive Systems

In this short video, Rob Dent (CMRP, CRL) from SDT, details the use of ultrasound technology to detect faults in belt drives.


One small but vital component of many machines is the belt sheave. Belt sheaves can sustain damage from everyday wear and tear, misalignment, and contamination.

The benefits of using ultrasound to find defects in belt sheaves:


  • Early Detection: By regularly scanning belt sheaves with an ultrasound device, maintenance teams can detect unusual sounds that indicate wear or misalignment early on. This early detection allows for timely intervention before a minor issue becomes a major problem.
  • Non-Invasive Check: Using ultrasound is non-invasive, meaning you don’t need to stop production to check the condition of the belt sheave. This makes the process quick and hassle-free.
  • Precision: Ultrasound technology provides precise information about the condition of the belt sheave, helping maintenance teams pinpoint the exact problem and take appropriate action.


Using ultrasound to detect bad belt sheaves is a smart, efficient way to maintain machinery. It allows for early detection of issues, saving time, money, and increases safety.

Our recommended SDT ultrasound tools for belt sheave inspection.

SDT200

SDT270

SDT340

Visualizing Success: Incorporating Pictures to Routes with SDT340


Setting up routes using SDT UAS3 software with the SDT340 includes a feature that greatly adds to the efficiency of the measurement taking process.

Some routes can have dozens or even hundreds of measurement points. By adding pictures to the measurement data in the UAS3 software it allows the user to specify the locations where data will be collected. When the route is uploaded to the SDT340, the pictures can be displayed on the screen while taking data. With the picture feature, technicians can visually confirm each measurement point, providing a clear reference.

UAS3 location identification

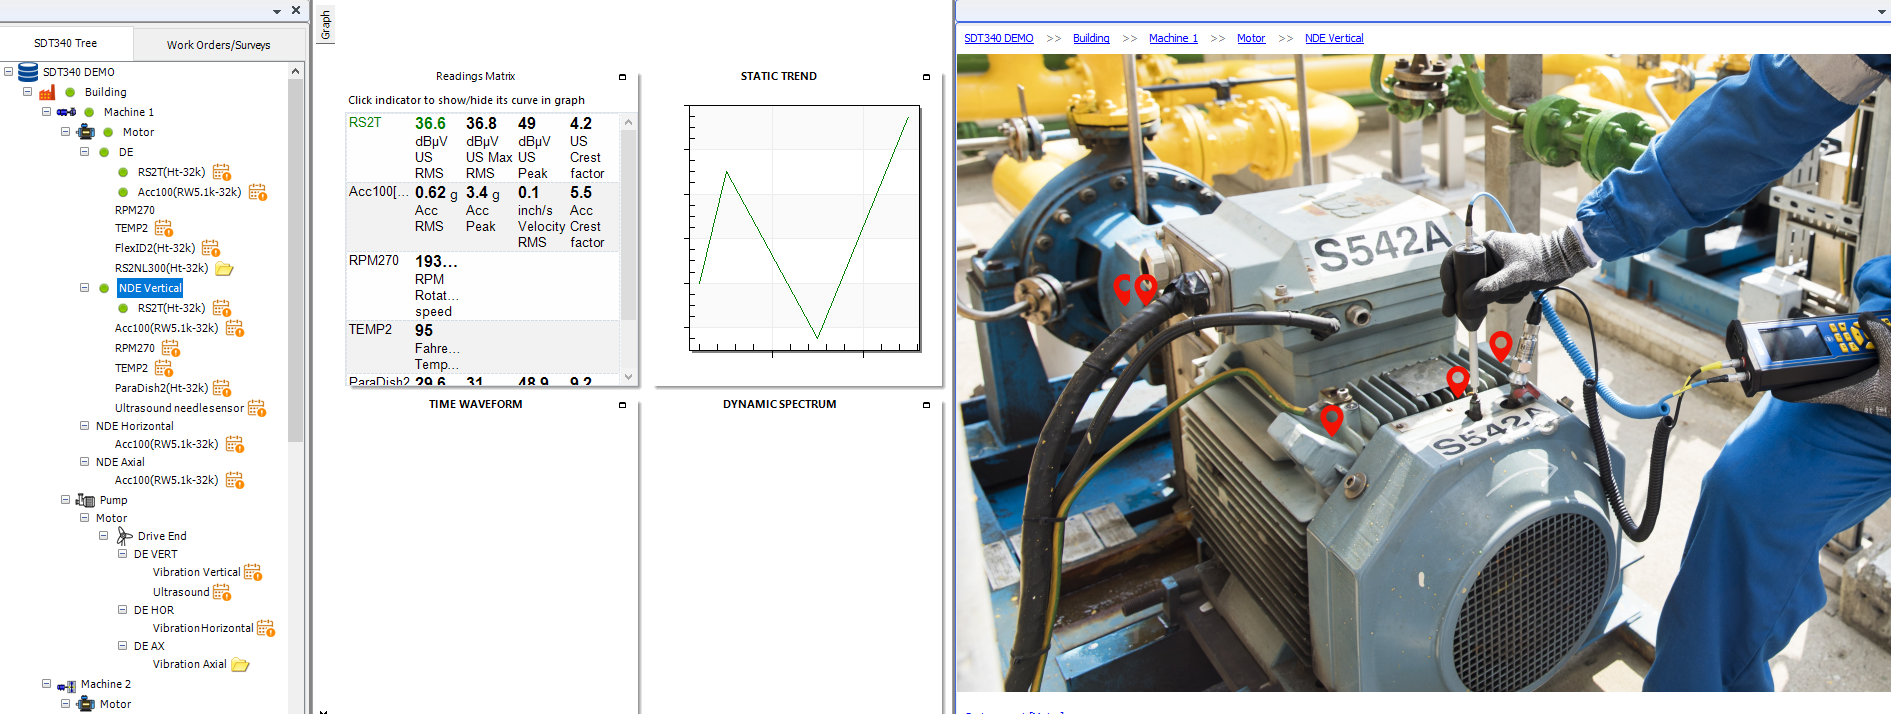
Pictures can be added to measurement points in the UAS3 tree structure. Then when sensors are added to the measurement point, an icon will be displayed on the picture representing that sensor. The sensor icon can then be moved around in the picture to represent the exact location on the machine that the sensor should be mounted to record data.

SDT340 measurement points, pictures to routes sdt340

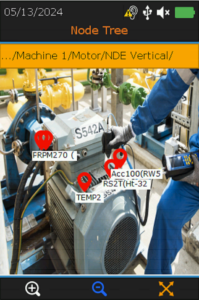
The route is then uploaded to the SDT340. When the technician brings up a measurement point, the pictures can be viewed by pressing F1, helping the technician to verify where the data should be collected.

SDT340 measurement points zoomed

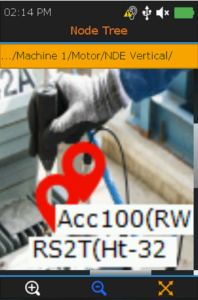
The picture can then be zoomed in with F1, out with F2 and scrolled with the navigation arrows as needed.

Click here for more information on UAS3
Click here for more information on the SDT340