Ultrasound and High Voltage
Precise was part of an ultrasound training course at a steel plant in Ohio. During training, the maintenance manager learned about measuring for Corona, arcing, and tracking with an ultrasound tool. We were asked to take some readings of their high voltage towers to detect if there was any indication of potential Corona damage. Corona can be easily detected by ultrasound above 2,000 volts.
The previous week a transformer below the high voltage insulators failed. (The input voltage exceeded 100,000 volts and was coupled down to 800 volts in the transformers. This was used to provide the high current needed to melt the steel.)
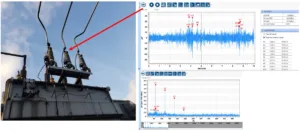
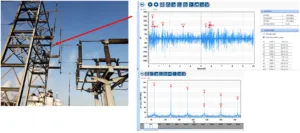
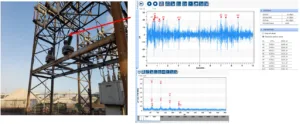
A time waveform signal and spectrum were taken using an SDT270. We took the measurements with a parabolic sensor because of the high voltages present and distance needed for safety. There were four condition indicators collected; RMS, max RMS, peak, and crest factor. RMS is the average signal and max RMS is the average of the twenty highest peaks.
Peak is the highest value recorded during a measurement and crest factor is the level of severity using a ratio of peak to RMS. The key indicators for this application are peak and crest factor.
As shown in the spectrum below the signals have spikes that relate to 60 HZ and its harmonics. The 60HZ spike and its harmonics validate the source of the time waveform. This noise could be a precursor to damage. (Corona has a build-up and drop-off of energy, resulting in a buzzing sound accompanied by subtle popping noises.)
The proper way to analyze the data is to trend over time and take note of the changes in the time waveform and the condition indicators.
Using ultrasound for electrical inspections can enhance the possibility of detecting anomalies and increase safety during inspections.
Corona
is an electrical discharge caused by the ionization of a fluid such as air surrounding a conductor carrying a high voltage. The air has undergone electrical breakdown and become conductive, allowing charge to continuously leak off the conductor into the air.
Arcing
is an electrical breakdown of a gas that produces a prolonged electrical discharge. The current through a normally non-conductive medium such as air produces a plasma; the plasma may produce visible light.
Tracking
is the formation of partially conductive, typically carbonized, pathways on the surface of insulating materials by electrical breakdown arcing. This ‘track’ is then an easier path for electrical leakage.
Ultrasound
Common ultrasound applications are electrical inspection, lubrication, leak detection, condition monitoring, steam trap inspection and tightness testing.
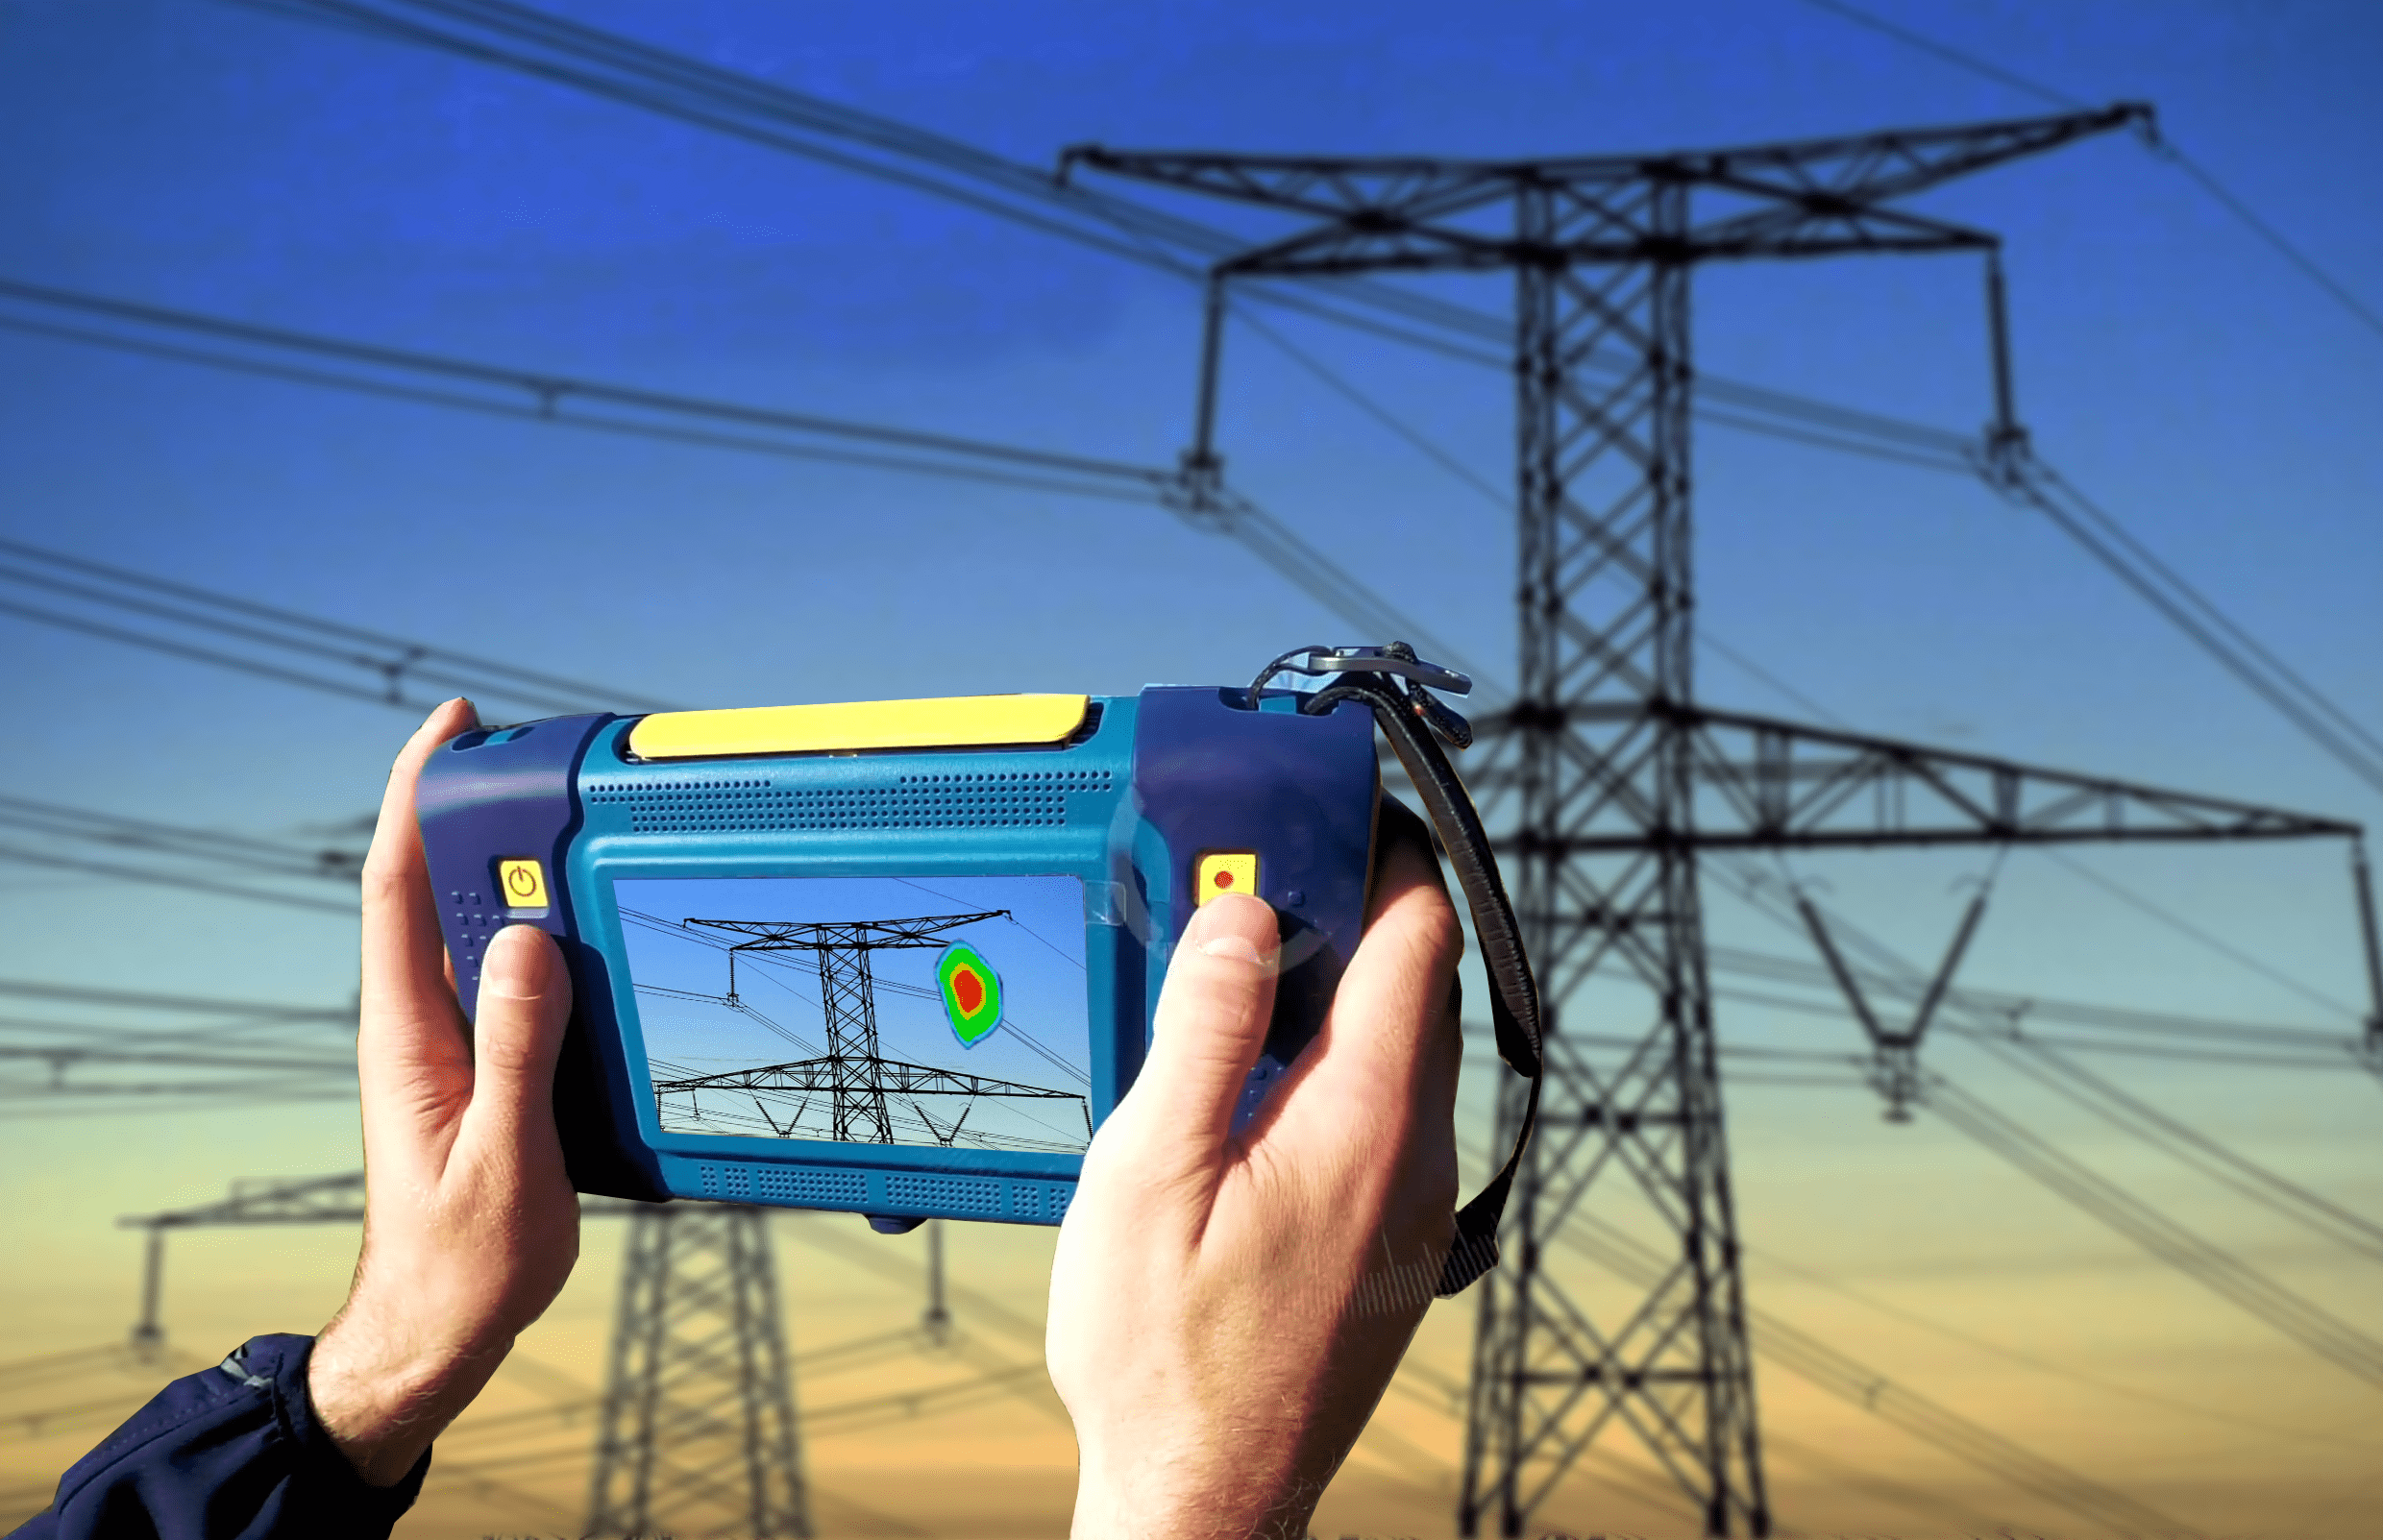
Recommended tools for electrical inspections are the SDT270, SDT340 and SonaVu
